

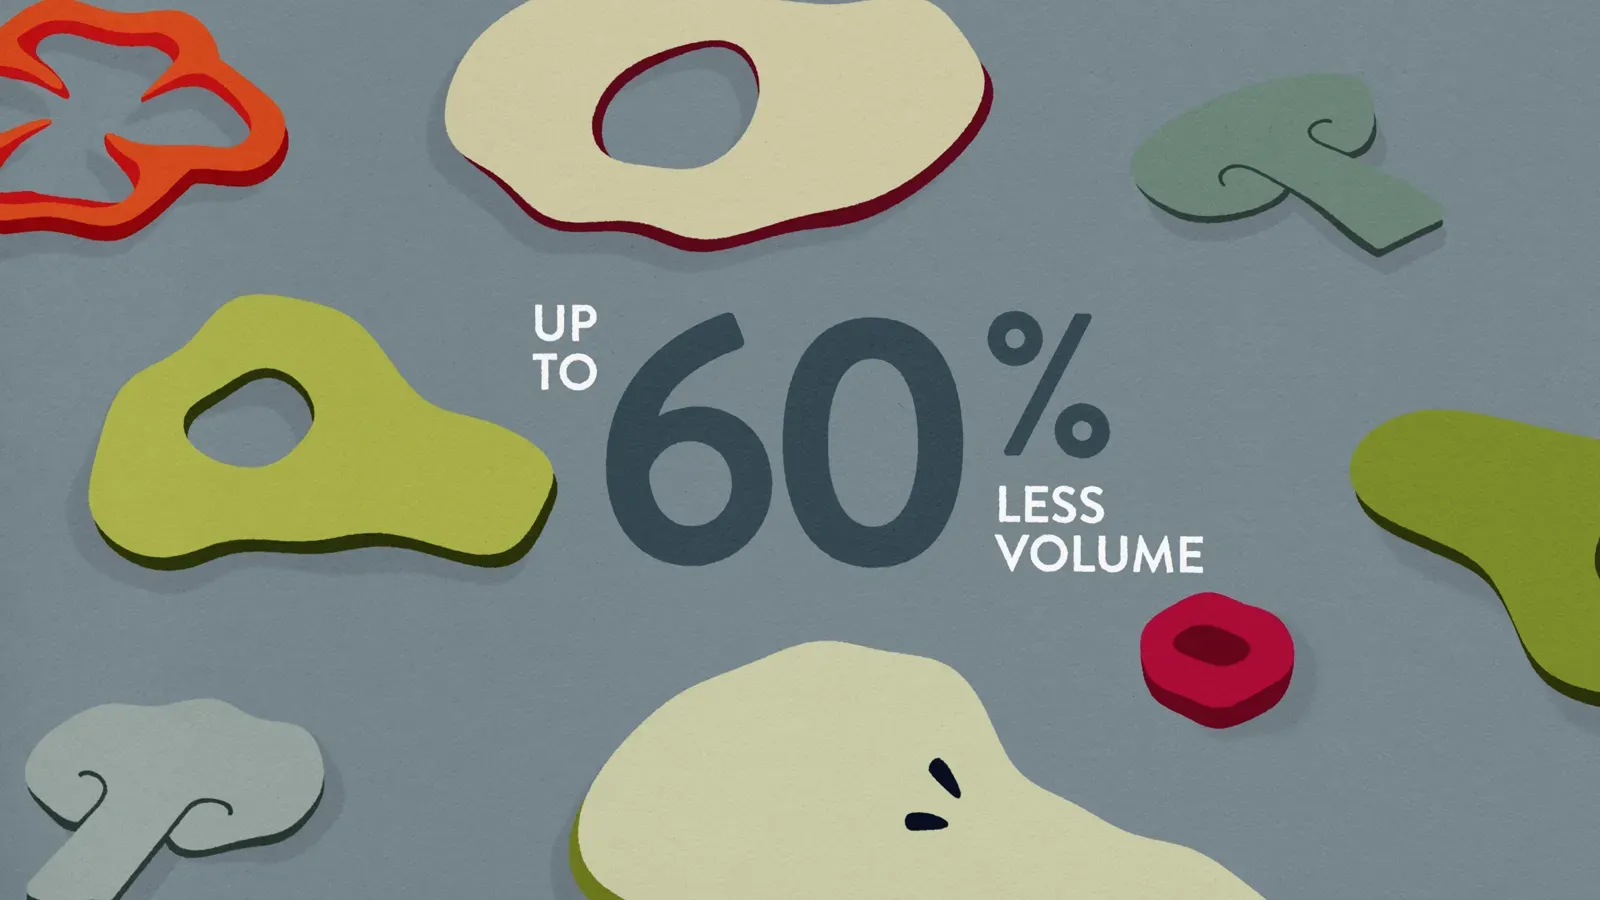
Animated infographics and data visualisation
One well-told number beats a thousand rows.
We turn reports, figures and processes into videos people understand first time: the idea that matters, in order, with just the right data. For annual reports, presentations, training and social media.
Who we’ve worked with








In short
What is an animated infographic?
An animated infographic is a video that tells a story with data, a process or a comparison, using charts, icons, type and illustration in motion. Unlike a static infographic, it orders information over time: first the context, then the figure and finally the conclusion, and it can include voice-over and subtitles.
Compared with a template tool, the story, the style and the hierarchy of the data are designed for your case and in your brand.
What an animated infographic is for
Making a figure understood, and remembered. Three real projects.
- 01
Making a figure stick
The Essence Food animation: its commitment to sustainability and how it cuts food waste, with the figures animated inside the illustrations.
Essence FoodEssence Food
View the case study  02
Explaining a set of steps so nobody gets lost
For Fundación Mapfre: how to fit snow chains to your car if you get caught in the snow, step by step and kept simple.
Chains and tyresFundación Mapfre
View the case study 03
Helping people choose between options
For Fundación Mapfre, four different savings challenges, explained so each person can choose which one to start with.
Savings challengesFundación Mapfre
View the case study


What you can tell with data
Annual reports and results
A company’s or foundation’s figures for the year, ordered so what matters stands out.
Processes and protocols
How something works, step by step: a service, a manufacturing process or a safety protocol.
Comparisons
Before and after, one option or the other, here or there: contrast is easier to grasp in motion.
Timelines
The story of a company, a project or a sector, with its milestones.
Maps
Where everything is and how it moves: offices, routes or coverage.
Static infographic, template or bespoke animated infographic
Each has its place. If a template is all you need, we’ll tell you.
| Static infographic | Template (Genially, Canva…) | Bespoke animated infographic | |
|---|---|---|---|
| What it is | An image with data and charts | An animation built from ready-made parts | A video designed for your case and in your brand |
| When it’s enough | A document or web page people read at their own pace | A quick internal presentation | When the data has to persuade, be explained in order or represent the brand |
| What it can’t do | Guide the eye: the reader decides the order | Stand out: it looks like everyone else’s, and your brand is hard to spot | Be done in an afternoon: it takes a script, design and animation |
How we work
Five stages, and the first is the most important: deciding which figure leads.
Start with the briefStep 1: Data and brief
You send us the report, the spreadsheet or the presentation, and tell us who it’s for and where it will be seen.
You getThe figure that leads, and a proposal with a quote
Step 2: Script
The story the data tells: what goes in, in what order and what stays out.
You getThe script, with the data that makes the cut
Step 3: Style and storyboard
Charts, icons and type in your brand, scene by scene.
You getStyle frames and storyboard
Step 4: Animation
First an animatic with a scratch VO, to get the pacing right. Then the animation itself.
You getThe animatic and the animation
Step 5: Sound and delivery
Voice-over, music and every version you need.
You getThe final video in every format


Frequently asked questions
What’s the difference between an animated infographic and an explainer video?
They’re very close: both explain something through animation. An animated infographic puts data at the centre, with figures, charts and comparisons; an explainer video puts an idea or a process at the centre, and can lean on characters or a story. Many projects mix the two.
Explainer videosCan you animate an infographic we already have?
Yes. We start from it to keep the data and the style, and decide what to animate and in what order so it works better on video than on paper. Sometimes it pays to simplify: a video can’t hold everything a page can.
What do you need from us to get started?
The data or the source document (a report, a spreadsheet or a presentation), who it’s aimed at and where it will be seen. Your brand guidelines too, if you have them: typefaces, colours and chart style.
How much does an animated infographic cost?
It depends on the length, how many figures and charts need designing, the level of illustration and whether it needs voice-over or versions in other languages. Send us the source document and we’ll put together a proposal with a quote.
When is a template tool enough?
For an internal presentation, a one-off piece or a very tight budget, a template may well be enough. Going bespoke is worth it when the data has to convince someone outside the company, when the piece represents the brand, or when something complex has to be explained in order.

What data do you need to get across?
Send us the document, or tell us which figures matter and to whom. We’ll get back to you and set up a time to talk it through properly.
info@isla-studio.com







The Isla Studio teamVideo production studio in Madrid